
I am a huge believer that if you want to make any kind of change in your life, you will probably have to implement some type of tracking system to make sure you are progressing towards your goals (and if you are not, course correct!). I track everything from calories in / out, money in / out (see the analogy comparing the two here), distance cycled, time spent playing piano, and more!
Money wise, I have personally tracked every single penny (or shall I say cent since some people may not know what a penny is these days) in and out of my life since January 1, 2011.
It is completely normal, expected, and even legally required for businesses to track their finances but why don’t individuals treat their household more like a business? When businesses track their finances, they produce a set of financial statements that help give various stakeholders (owners, investors, bankers, tax authorities, etc.) a view of the health and profitability of the business. The two most well known financial statements for a business are the Income Statement and the Balance Sheet.
- Income statement (or profit/loss statement) – this is expressed for a period (e.g. month, quarter, or year)
- Sales revenues
- (-) Expenses
- = Profit (Loss)
- Balance Sheet – this is expressed at a point in time (e.g. as of December 31, 2019)
- Assets
- (-) Liabilities
- = Equity
I have a strong view that we should treat our households like businesses, regularly generating statements to analyze the financial health of our household and how the household’s “profitability” changes over time.
Benefits of tracking your individual finances like a business:
- Control: Knowing where you stand on a regular basis (I do monthly) is critical to maintaining control of your finances and reducing financial stress in your life. If you take the “head in the sand” approach of not knowing where you stand financially, you’re not going to feel secure and money is more likely to cause stress in your life. Ignorance is not bliss here!
- Progress & Motivation: When you track your finances, you are more likely to progress towards your goals. When you make progress and are able to see it on paper every month, it is extremely motivating! Celebrate your wins and investigate things that may be hindering your progress.
- Accountability: Once a month check-ins with a trusted family member, friend or financial coach create accountability – making sure that your spending remains aligned with your values, and it also gives you an opportunity to weigh certain financial decisions (e.g. should I buy that fancy watch that’s been on my mind for months?) with someone else.
- Optimization: Tracking your expenses provides a view into where you are spending your hard earned money. This view gives you an incredible power to optimize your finances – for example, it easily shows your largest spend categories thereby giving you a good sense of which levers to pull to create the biggest impact on your savings. It also gives you the ability to make smaller changes that can compound to a big difference. Most people who start tracking their expenses notice that they start saving money simply by being more conscious about their spending.
- Transparency: People who don’t track their finances may not notice certain things – one of my friends didn’t realize that he had been paying for two Netflix subscriptions by accident for some months! Another example is credit card debt – when you see a minimum payment of only $50, it may not seem like a big deal. That said, when you sum up the hundreds of dollars of interest that you’ve been paying for months, it really highlights how much of a drag that debt may be creating on your financials.
- Dare to be different: If you do what everyone else does, you get what everyone else gets. Most people don’t track their finances and this has led to record low savings rates and record high household debt.
- Catch the bad guys: Some people don’t even look at their bank account or credit card statements. Ever! If you regularly review your bank account and credit card statements, you will catch fraudulent transactions quicker than you would otherwise. Most people I know have had their debit and/or credit card compromised at least once.
Example of household financial statements:
- Personal Income Statement (Income / Expenses / Savings)
- Gross Earnings (salary, investment income, side business income, etc.)
- (-) Taxes, CPP contributions, EI contributions, etc.
- = Net Earnings (after tax)
- (-) Expenses (essential expenses, discretionary expenses)
- = Savings
- Personal Balance Sheet (Networth)
- Assets (bank accounts, investments, real estate, cash, etc.)
- (-) Liabilities (credit card debt, mortgage debt, lines of credit, personal loans, etc.)
- = Net worth
In addition to financial statement type reports that may be unexciting to some, I use highly visual charts to give a graphical representation of my finances on a monthly basis. I’ve been doing this for years and recently brought my wife on board. Just as a business has regular “shareholder meetings”, we have “household finance meetings” on a monthly basis (we just had our 22nd monthly meeting in August 2020). Each month we prepare our statements and charts (both individual and combined) and then meet to discuss the month. We have found this hugely beneficial as it keeps us on track – ensuring that we are always living within our means, spending our money consciously on the things that we value most, and saving a good chunk towards our Financial Independence goals. The monthly meetings are also a good forum to discuss investment performance, asset allocation, major upcoming expenses, taxes, insurance, and more! This level of financial transparency and accountability encourages us to stay aligned on our earning/ spending/ savings plans, in addition to ensuring that there are no unintended surprises (I’ve read that money is the leading cause of relationship stress).
Here is a simple example of a Networth chart:
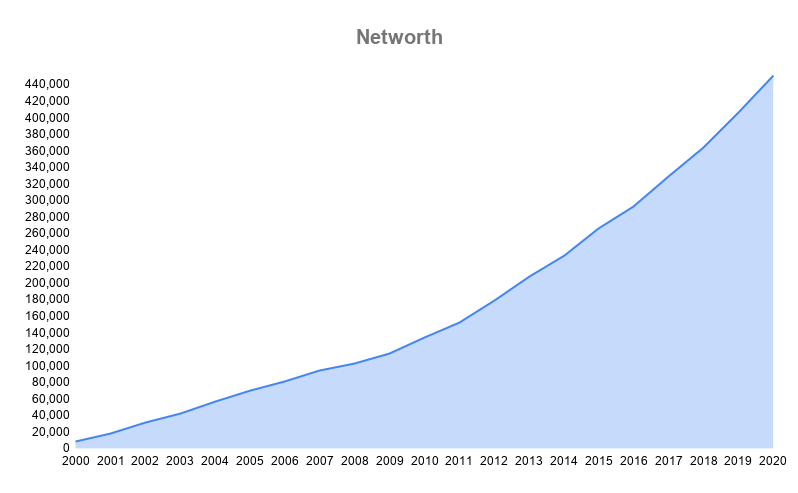
It can be extremely motivating to watch this number grow over time.
In Vicky Robin’s book, “Your Money or Your Life” , Vicky suggests implementing a “wall chart” system whereby you track your monthly work income, monthly expenses, and monthly investment income. For months where income exceeds expenses, you save money. As your savings start to accumulate and as those savings are invested, you start to generate investment income. Eventually you get to the point where your investment income starts to cover a portion (and eventually, all) of your monthly expenses. The point at which your monthly investment income exceeds your monthly expenses is referred to as the “crossover point” and represents the point of financial independence (where you no longer need to trade your time for money since your income from your investment portfolio is covering your expenses). Here is a picture of Vicky’s recommended “wall chart”:

After experimenting with several different options over the last decade, I have created my version of the “wall chart”. Here is JBFI Inc.’s version of the “wall chart”:
 Each bar represents one’s overall financial position for a period (I usually do both monthly and yearly), and the green line shows how the financial position changes over time (upward sloping line means an accumulation of positive savings every year).
- Whole bar for each year = total income/money into your life for the given year.
- Blue segment = mandatory deductions (e.g. federal and provincial taxes, CPP contributions, EI payments).
- Everything below the blue segment is your “net income after taxes”. This is money that is available to be either spent or saved:
- Black segment = essential expenses (e.g. rent, utilities, groceries, clothing, etc). These should generally be stable from month to month.
- Red segment = discretionary expenses (i.e. for the purchase of items that are “wants”, not “needs”). These expenses tend to be more volatile from month to month.
- Green segment = savings (i.e. money left over after deductions, essential expenses, and discretionary expenses).
- Green line = investment income. For example, if your networth was $100,000 and you earned a 4% return on that amount in a year, your investment income would be $4,000. This is a very powerful line as it shows how much of your expenses can be covered by your investment income. The goal is to eventually get to the point where your investment income covers your essential expenses (i.e. lean FI) and eventually all of your expenses (full Financial Independence). This is similar to the “crossover point” concept that Vicky Robin introduced in “Your Money or Your Life” .
I choose to do all of my tracking in spreadsheet format for a couple of reasons:
- Flexibility – you can build things exactly how you want it rather than being confined by how a software developer thinks (truth is, I’m a big spreadsheet nerd)
- Tracking shouldn’t be made too easy – some of you may disagree, but I do think there is value in having to manually enter your transactions as it helps to reinforce conscious spending (now on what degree of labour is effective, let’s debate this on another day)
To get started with tracking, take a look at the JBFI Inc. coaching program! I provide each of my clients with a Google Sheets tracking spreadsheet and a web form that makes data entry fun and easy (especially for those who’re new). I’m happy to help you set it up and be your accountability partner along the way.
If you prefer not to go the manual route, I’ve heard of others having success with programs that will do the heavy lifting for you. For example:
Maybe you aren’t a fan of computers at all. Not to worry. All of this can also be done the old-fashioned way and achieve the same results.
Pingback: The Financial Independence Ladder – JBFI Inc.
Pingback: Quarterly Progress Update #1-Q4 2020 | JBFI Inc.
Pingback: Financial Coaching the Average Canadian Household (Part 1 of 6) | JBFI Inc.