
Welcome to my second quarterly update. I decided to start providing quarterly updates on my own financial position so that you can follow me on my Journey to Be Financially Independent. The reason for this is threefold:
- To be upfront and transparent with my readers to show that I am practicing what I preach in my blog posts and coaching curriculum
- To share my successes and failures along the way, and be held accountable on my goals and aspirations
- To be an inspiration to others on their path to financial independence.
Since I’ve decided not to remain anonymous, I don’t plan to post specific dollar amounts to maintain some level of privacy, while still sharing enough to show a good overview and directional changes over time.
I landed on a quarterly updates instead of monthly updates since my financial position doesn’t change too much from month to month. Also, most of the Exchange Traded Funds (ETFs) that I own pay quarterly distributions so a quarterly update is a better reflection of my current investment income.
I hope you all like charts as much as I do! Here we go:
Networth since 2011 (I started tracking my finances in January 2011):
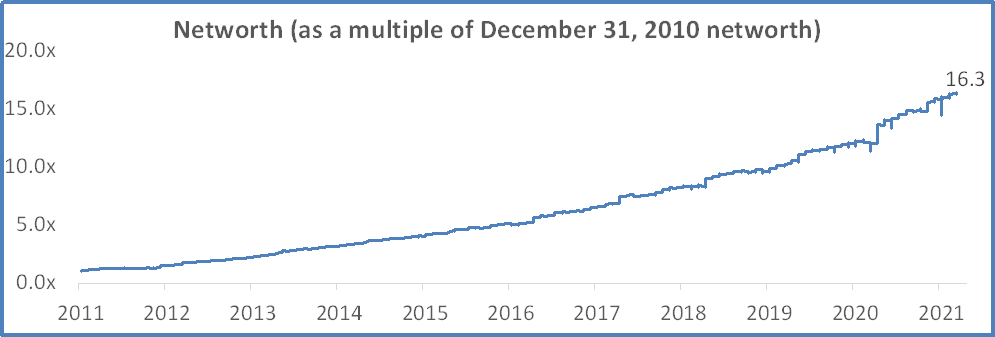
What do I mean by “as a multiple of December 31, 2010 networth”? My current networth is 16.3x what it was on December 31, 2010.
Change in Networth over the last quarter:
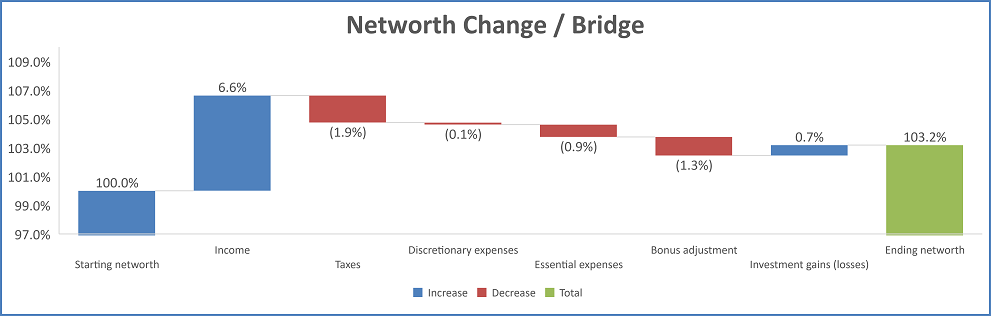
- Income
- Pretty standard quarter from an employment income perspective
- Taxes
- Pretty standard quarter from a tax point of view
- I do what I can to reduce my annual tax bill by making maximum contributions to my Registered Pension Plan (“RPP”) at work, Registered Savings Plan (“RSP”), and Tax-Free Savings Account (“TFSA”) – I wrote a post on these tax-advantaged vehicles here.
- Discretionary expenses
- Will discuss more under “spending and saving” below
- Essential expenses
- Will discuss more under “spending and saving” below
- Bonus adjustment
- I get paid an annual bonus each year and include 1/12th of that bonus in each month’s “income”
- Since it is only paid once during the year (in Q2), I needed to add an adjustment column so that the networth calculation will reconcile and my investment gains wouldn’t be over or understated.
- I get paid an annual bonus each year and include 1/12th of that bonus in each month’s “income”
- Income gains (losses)
- A more normal month for investment gains (losses) – more to come on this in the “ETF Performance” section below
Earnings for Q1, 2021 (January 1, 2021 – March 31, 2021):

- Employment income
- As you can see, most of my income currently comes from employment
- Investment income
- I track my investment income on a cash basis (only record a dividend / interest income when cash is received)
- My total investment income was healthy in Q1 given all four of my Equity ETFs paid distributions in Q1 (paid in January / March / June / September each year)
- Equity ETFs pay quarterly distributions. Current annualized yields as of May 24th:
- XIC = 2.59%
- XUU = 1.18%
- XEC = 2.09%
- XEF = 1.63%
- I also have some equity funds within my RPP, however, those investment vehicles do not pay distributions (rather they are re-invested)
- Fixed income ETF pays monthly distributions. Current yield:
- VSC = 1.2%
- High interest savings accounts pay monthly interest. Current yield:
- Tangerine High Interest Savings account = 1.75% (promotional rate until July 15th) – regular rate is 0.10% right now
- TD Waterhouse High Interest Savings Account = 0.20%
- My private investments do not pay dividends
- My GIC portfolio does pay distributions, however, I have these compound annually rather than pay out every year, therefore, will only log these upon maturity of each 5-year GIC
- The average rate I am receiving on my GIC portfolio is 2.38%
- Equity ETFs pay quarterly distributions. Current annualized yields as of May 24th:
- Credit card rewards
- I have a few credit cards that allow me to optimize cash back and travel rewards. These are the four credit cards that I have for now:
- TD First Class Travel Infinite
- BMO World Elite Mastercard
- Tangerine Mastercard
- Scotia Passport Visa
- I plan to write a post on credit card rewards in the future so stay tuned
- Credit card rewards are not for everyone! I would not recommend having multiple credit cards (or any) if you plan on holding a balance from month to month and not pay the card off in full
- I have a few credit cards that allow me to optimize cash back and travel rewards. These are the four credit cards that I have for now:
- Other income
- No other income this quarter
Spending for Q1, 2021 (January 1, 2021 – March 31, 2021):

- Essential expenses
- Significantly higher than normal “essential expenses” in the last quarter due to costs associated with buying a house (we moved at the end of April so we were still paying rent during Q1).
- Top 3
- Housing – Home improvement / Rent
- We bought new vanities for each of our 3 bathrooms, replaced all interior doors including trims, and replaced flooring in 2 of the bathrooms
- Food – Groceries
- Life Insurance – paid a year’s worth of premiums in March
- Housing – Home improvement / Rent
- Discretionary expenses
- Another low quarter for discretionary expenses – aligned with the COVID lockdown!
- Top expenses
- Household
- Car – mostly insurance and registration paid in Q1
- Gifts
- Takeout – definitely increased as we prepared for our move
Savings for Q1, 2021 (January 1, 2021 – March 31, 2021):
- Savings rate
- My overall savings rate for the quarter came in at 78.9% (of net/after tax income)
- This was just below my 2021 target of 80%
- Yes, this number is high, however, let’s not forget that it has taken me a decade of hard work to get here. If your current savings rate is on the lower side, don’t be discouraged! Be encouraged!
- My overall savings rate for the quarter came in at 78.9% (of net/after tax income)
YMOYL wall chart
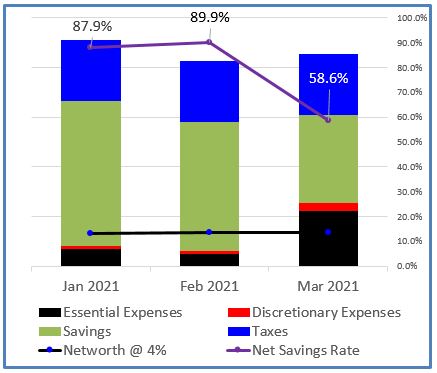
- This is my version of Vicky Robin’s “Your Money or Your Life” wall chart. I explained the chart above in my post, “Household Inc. – Tracking Your Household Finances Like a Business”
- Each bar represents my overall financial position for one month
- Whole bar for each month = total income or money into my life for the given month
- Blue segment = mandatory deductions (e.g. federal and provincial taxes, CPP contributions, EI payments)
- Everything below the blue segment is “net income after taxes”. This is money that is available to be either spent or saved:
- Black segment = essential expenses (e.g. rent, utilities, groceries, clothing, etc). These should generally be stable from month to month
- Red segment = discretionary expenses (i.e. for the purchase of items that are “wants”, not “needs”). These expenses tend to be more volatile from month to month
- Green segment = savings (i.e. money left over after deductions, essential expenses, and discretionary expenses)
- Black line = investment returns. This is a very powerful line as it shows how much of my expenses would be covered by my investment returns, assuming my portfolio’s total return was 4% per year. The goal of financial independence is to get to the point where your investment returns cover your essential expenses (i.e. lean FI), and eventually all of your expenses (full Financial Independence). This is similar to the “crossover point” concept that Vicky Robin introduced in “Your Money or Your Life”
- As you can see, my current portfolio, invested at 4%, covered my fixed and discretionary expenses in January and February, but not March
- This will be the new normal for me with a house and a kid. That said, we will see how things change over time
- Purple line = net savings rate for each month within the quarter
- Each bar represents my overall financial position for one month
Other Financial Metrics for Q1, 2021 (January 1, 2021 – March 31, 2021):
- Current Portfolio Yield as of March 31, 2021 = 1.26% (weighted average)
- Cash Interest for Q1 2021 = 1.28% (annualized)
- Essential Expense Coverage (Yield ÷ Essential Expenses) = 21.7%
- Total Expense Coverage (Yield ÷ Total Expenses) = 18.7%
- Cash Investment Income ÷ Essential Expenses = 38.3%
- Cash Investment Income ÷ Total Expenses = 32.9%
Total Return vs. Yield vs. Cash Interest
- First of all, it is important to note that the above financial metrics are based on portfolio yield and cash interest, not total return. Total return includes all sources of investment return (both cash flows from interest and dividends) and capital gains or losses over time, whereas the yield and cash interest numbers that I quote exclude capital gains and losses
- There is a difference between what I call “Yield” and “Cash Interest”. I choose to track both since as you can see from above, the two metrics can vary quite significantly from one month/quarter to the next
- “Yield” is forward looking (based on the weighted average dividend / interest income rate of my investments going forward)
- “Cash Interest” is based on how much cash interest (e.g. dividends/interest income) my portfolio generated during the quarter.
Asset allocation as of March 31, 2021


- Private vs. Public vs. Cash
- Private investments
- Real Estate – I had a 25% allocation to Real Estate in Q1 that was earmarked for a house purchase (which closed in April 2021). I decided to sell the REIT in my RPP given that I will have a significant amount invested in real estate via the purchase of my principal residence
- Personal Loans – I have a few personal loans that are still outstanding
- Angel Investments – A few years ago, I was a member of an angel investing club and made two investments in early-stage private ventures. It is important to note that angel investing is not for everyone. Investing in early stage companies is a high risk / high reward proposition. I invested in these ventures knowing very well that I could lose 100% of what I invested. That said, the experience was a great learning experience and I felt like I was on Dragons’ Den. I decided to take some time off angel investing after making my first two investments since I committed to angel investments being less than or equal to 10% of my overall portfolio (I didn’t want to be tempted by new investments that could potentially tilt the risk of my overall portfolio to a level that was higher than I wanted it to be). I will likely go back to angel investing in the future (when I exit one or both of my current positions). So far, both investments that I made are doing extremely well (on paper, not yet realized) as they have both brought in additional capital at much higher valuations relative to my initial investments. That said, I have kept these investments at cost/book value in my networth calculations until I realize the value through an eventual sale
- Public investments
- Fixed Income
- Other fixed income exposure
- VSC: Canadian Short-Term Corporate Bond Index ETF (VSC)
- I decided to buy this short-term corporate bond fund with some extra cash in my TFSA since my brokerage is only offering 0.20% on a High Interest Savings Account
- Guaranteed Investment Certificates (GIC) – Although several individuals pursuing financial independence use a 100% equity allocation rather than having any fixed income exposure, I’ve decided that I prefer having some money in fixed income investments (specifically, Guaranteed Investment Certificates and a short term corporate bond ETF). I realize that rates are low right now, however, I value having a lower level of volatility when things go sideways (or down) in the equity markets
- I started building a 5-year GIC ladder in February 2018
- This means that I bought a 5-year GIC every month since then and will continue to do so until January 2023
- I buy GICs that compound interest over the 5-year period and then pay out principal plus interest at maturity
- Starting February 2023, I will have a GIC maturing every month (initial principal plus accrued interest will be paid out)
- Currently, I don’t include the interest accrued to date in my networth calculation since the GIC’s are not redeemable prior to maturity
- Other fixed income exposure
- Equities
- Exchange Traded Funds (ETF) – I chose to invest in 5 exchange traded funds (more on this below in the ETF Performance section)
- I choose a four-ETF portfolio for my equity exposure
- Since I cannot buy low-cost ETFs within my Registered Pension Plan at work, I allocate this account between an International Equity index fund and a US Equity index fund
- Cash
- 35%+ cash! You must think that I am mad keeping that much cash on the sidelines (not invested) at this time, given my highest rate High Interest Savings Account (“HISA”) is only paying 1.75% right now. This high allocation was only temporary in the first quarter as my wife and I bought a house in April.
- Fixed Income
- Private investments
Investment changes (change over the quarter)
- New investments
- In addition to purchasing a 5-year GIC every month, I also purchase one of the four equity ETF’s listed above
- I practice what I call “dynamic rebalancing” – effectively rebalancing my portfolio by buying whenever something is underweight in my portfolio
- If I am above my target equity allocation, I will not purchase an equity ETF that month
- If I am below my target equity allocation, I will purchase an equity ETF that month (I select the ETF that is most underweight vs. my target)
- I paused my ETF purchases in the first quarter to build cash for the house purchase
- Investments sold
- I try to not sell investments (especially in my taxable/non-registered account) to avoid triggering capital gain tax. I prefer to take a long term approach and defer the capital gains for as long as possible
- I did sell some of my non-registered ETFs for the house purchase. I did so in a way that minimized the amount of capital gain tax I will pay.
ETF Performance:

- Another pretty big quarter performance-wise, with my Equity ETFs up between 2.4% and 7.4% and my short-term corporate bond ETF down 1.4%
- A note on performance:
- I decided to exclude the “since inception” performance on my ETF holdings since I didn’t think it would be meaningful to readers (I started buying each of these funds at different times and continued buying along the way through the “dynamic rebalancing” process I described above)
- For more thorough numbers on fund performance, please see the various hyperlinks above that reference the iShares and Vanguard websites
- Fees – the overall fees on my portfolio was 0.06% (6 basis points on an annual basis).
Conclusion:
- Overall, I am pleased with my FI progress for the first quarter of 2021. My increased essential spending (mostly due to purchases related to the new house) will remain for the next few months but I expect this will level off eventually. I am still very happy with my overall 78.9% net savings rate.
I hope that the above quarterly update gives you a good sense of how I track my income/expenses/networth and how I take a simple approach to investing and tracking my asset allocation from month to month. The fundamentals of my financial coaching program are based on lessons that I have learnt from tracking my finances religiously for the past decade. If you are interested in learning more about the program and/or booking a free consultation, please visit my financial coaching page. My program includes access to a proprietary tracking template (Excel and Google Sheets versions available) so you can have charts / visuals similar to what you’ve seen above. This provides a high level of transparency to your financial position and and tracks how you are progressing towards financial independence.
Disclosure: Everything provided above is for informational purposes only so you can see the approach that I take with my portfolio. DO NOT TAKE THIS AS INVESTMENT ADVICE. I’ve set up my portfolio according to my very personal risk and return preferences. If you are not individually qualified to set up your own investment portfolio, please consult a qualified investment professional for assistance.